
Italian interface, rules and conditions written by Copilot, model performance measurement, and a Security page
Work in Italian, describe a business rule, a transformation, or a workflow condition in plain words and let Copilot write the code, measure how much load a model you host yourself can take and size your deployment from it, and see your tenant's security posture, audit log, and live sessions in one place.
The interface in Italian
DocAI Fabric now speaks Italian. Open your profile menu and choose Italiano: the choice is saved to your account, so it follows you to every browser you sign in from. Product names and technical terms were reviewed against a glossary rather than translated word for word, so the Italian interface reads the way an Italian document team would say it.
This is the first release of a localization programme. More European languages are on the way, and each will arrive the same way: as a full interface, not a partial one.
Rules and conditions, written from a description
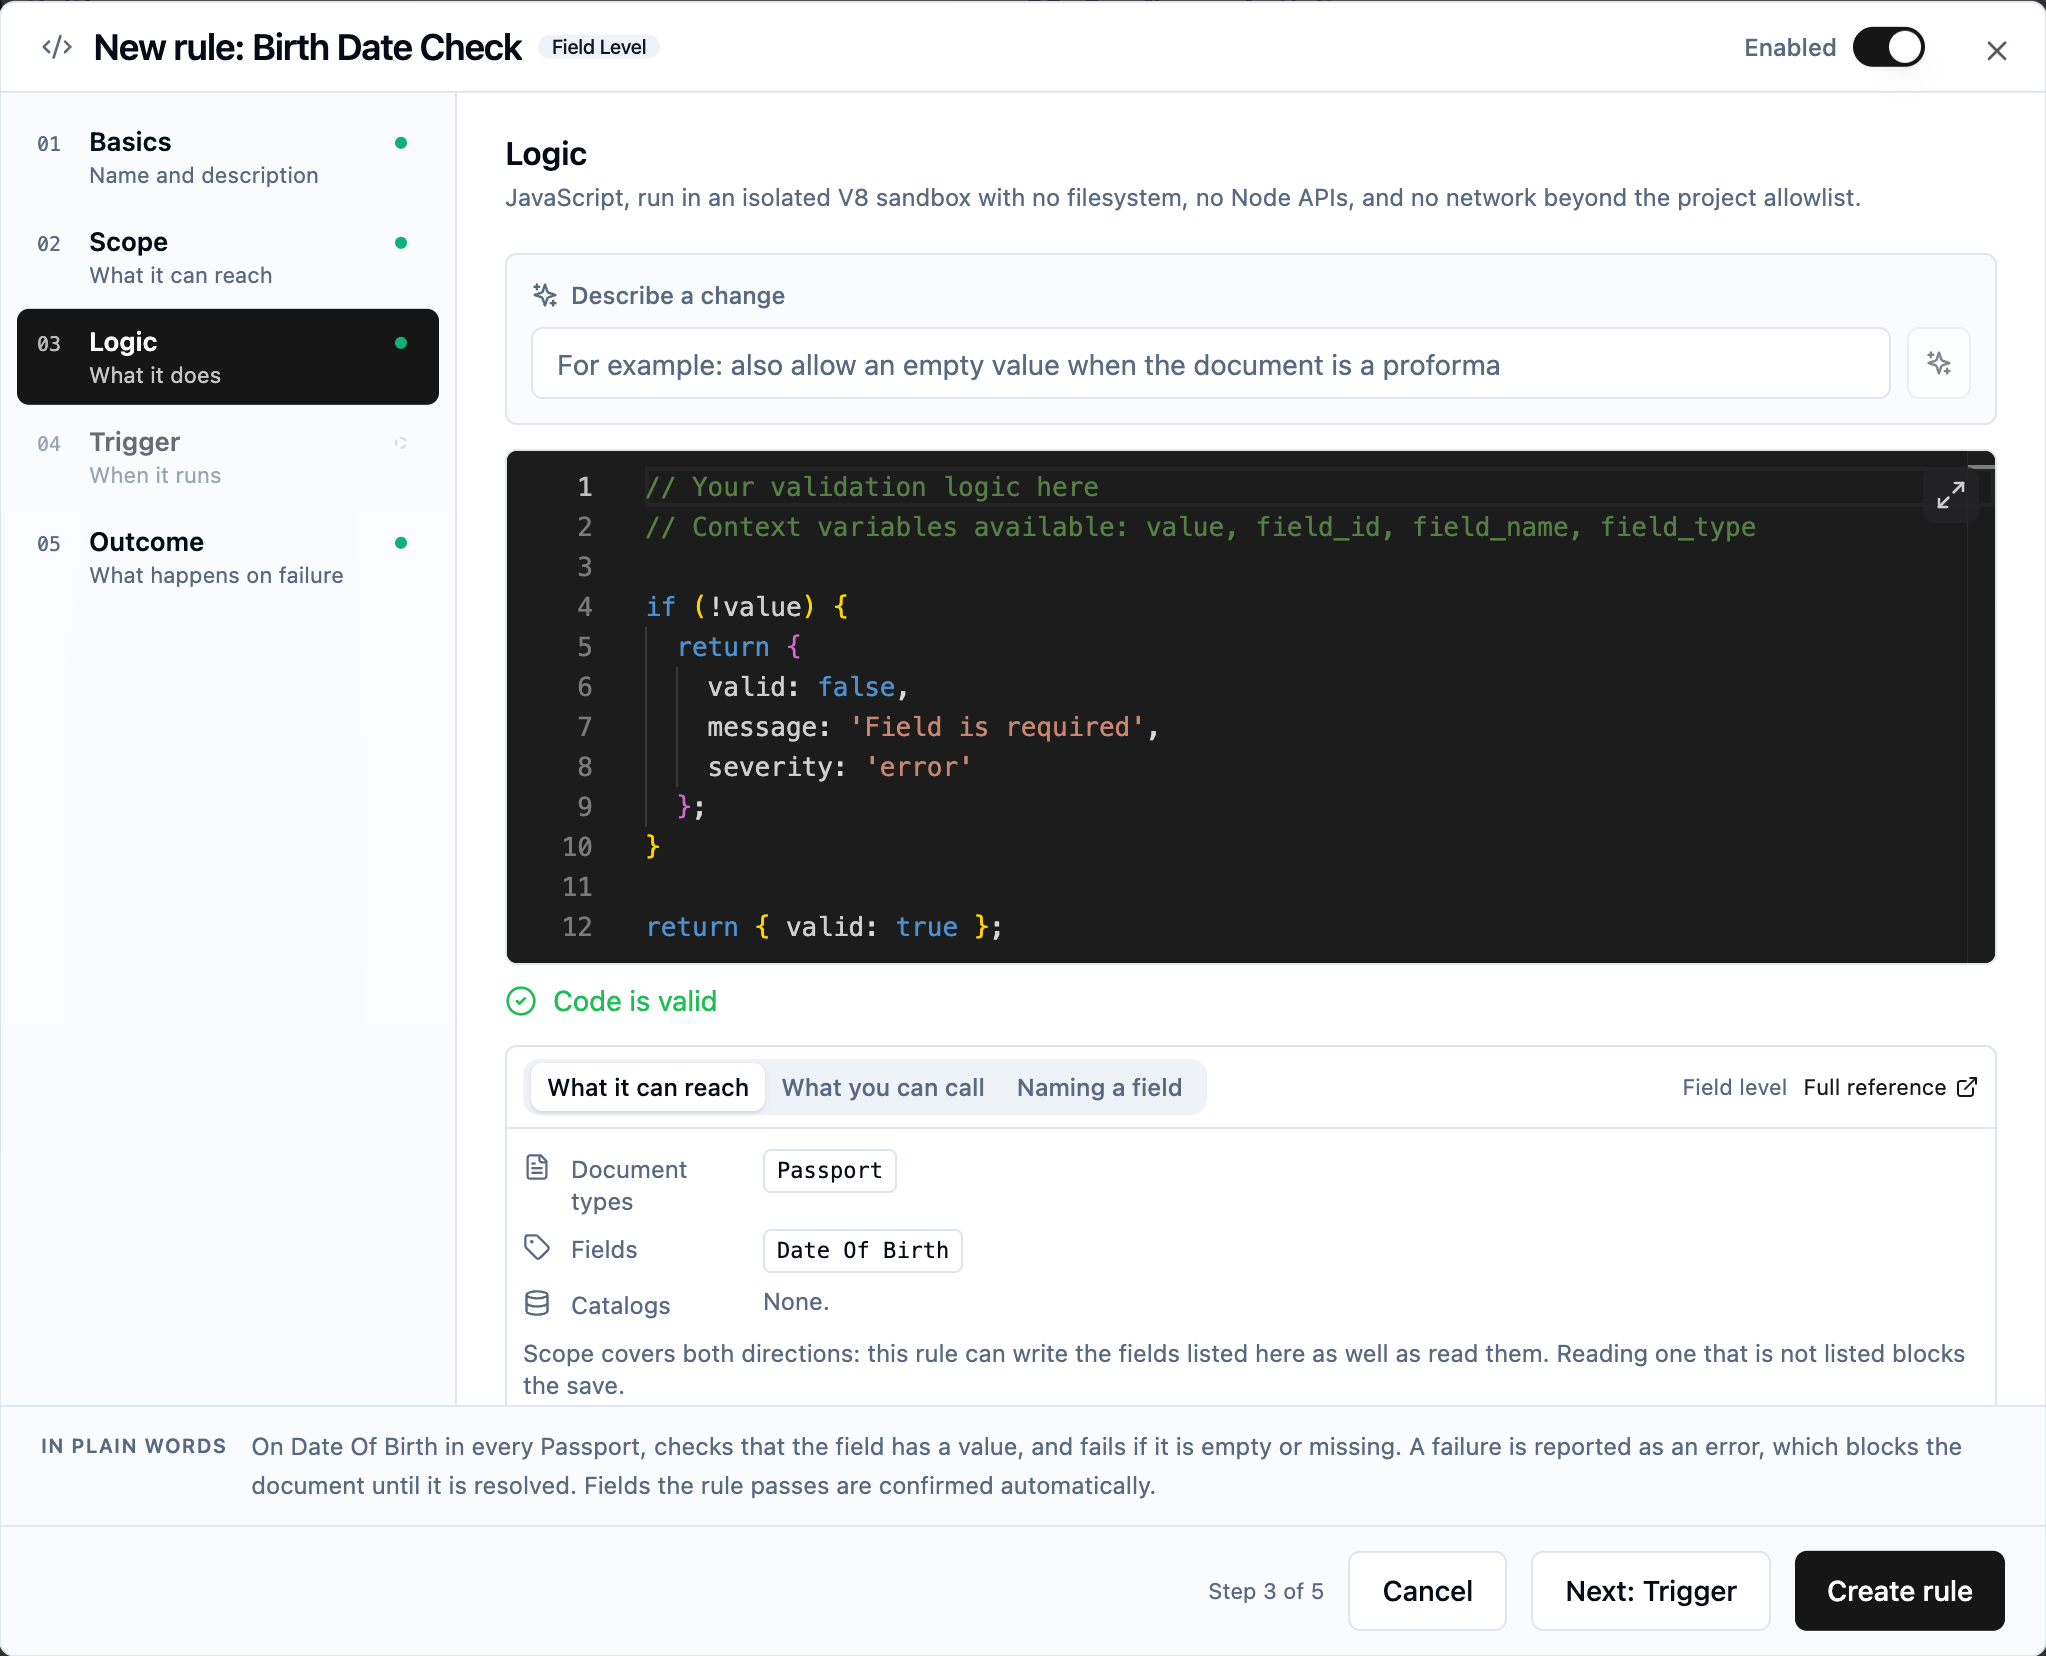
Business rules have a new home. Creating or editing a rule opens a dialog with five groups on a rail, Basics, Scope, Logic, Trigger, and Outcome, one shown at a time, and a plain-English sentence at the bottom that always describes the whole rule, so nothing you set is ever out of sight. A dot beside each group says whether it is complete or still needs a decision, and Save stays off until every decision is made, with the reason shown beside it. See business rules.
The bigger change is who writes the code. Low-code presets have covered the standard checks for a while: required values, formats, sums, catalog lookups. For anything the presets cannot express, you used to write JavaScript. Now you describe it. Under the code editor, Describe a change takes what the rule should do in your own words (“also allow an empty value when the document is a proforma”) and Copilot writes the code against your project’s own document types and fields. A change to existing code comes back as a diff you read before accepting, and nothing is saved until you save the rule.
The same box appears wherever the platform takes code:
- Validation rules at field, document, and transaction level. See code rules.
- Data transformation scripts in the workflow, which Copilot can now write from scratch or rewrite, with a one-line description of what the script does shown when the section is folded. See data transformation.
- If and Switch conditions in the workflow: describe when the true branch is taken, or when a case applies, and the condition is written for you. See control flow.
Every draft is checked the way a save is (syntax, and calls to helpers that do not exist) before you see it, and a reference panel under each editor lists exactly what the code can reach: the document types, fields, and catalogs in scope, the helpers it can call, and worked examples of naming a field, built from your own project.
Accents and diacritics
Names and addresses arrive with accents, and the same person is “Gökçe Ünlü” on one document and “Gokce Unlu” on the next. Every preset that compares text case-insensitively now ignores diacritics on both sides too, so a catalog match or an equality check no longer fails on an accent. When the stored value itself has to lose its accents, typically because a downstream system cannot take them, the new Diacritic Normalization rule rewrites it and keeps the case. See accents and diacritics.
Measure a model before you depend on it
A model you host yourself is a promise: that it will do the work its tasks need, fast enough for your volume. The Models page now lets a tenant administrator check both. Test confirms an endpoint is reachable and can do the tasks it is assigned. Performance measures numbers, per endpoint:
- Input and output token rates for a single stream.
- What a page image costs, in seconds and tokens, which decides whether an image-sending activity is affordable at your volume.
- Capacity under concurrency: the same request at 1, 2, 4, 8 streams at once, reported as tokens per minute, the point where more streams stop buying throughput, and the point where the provider rate-limits. A single stream cannot tell you this; an endpoint often delivers several times more under load than one stream shows.
The results are in the same units as the Performance Calculator, which turns your document volume into a required throughput. Divide that by the capacity measured per endpoint, round up, and you have the number of model deployments your volume needs. Register them as endpoints of the same model and the pool spreads the load across them. See testing and measuring models.
On a self-hosted deployment, the same probes run from the CLI against the system models that serve every tenant. See test and measure models.
A Security page for the tenant
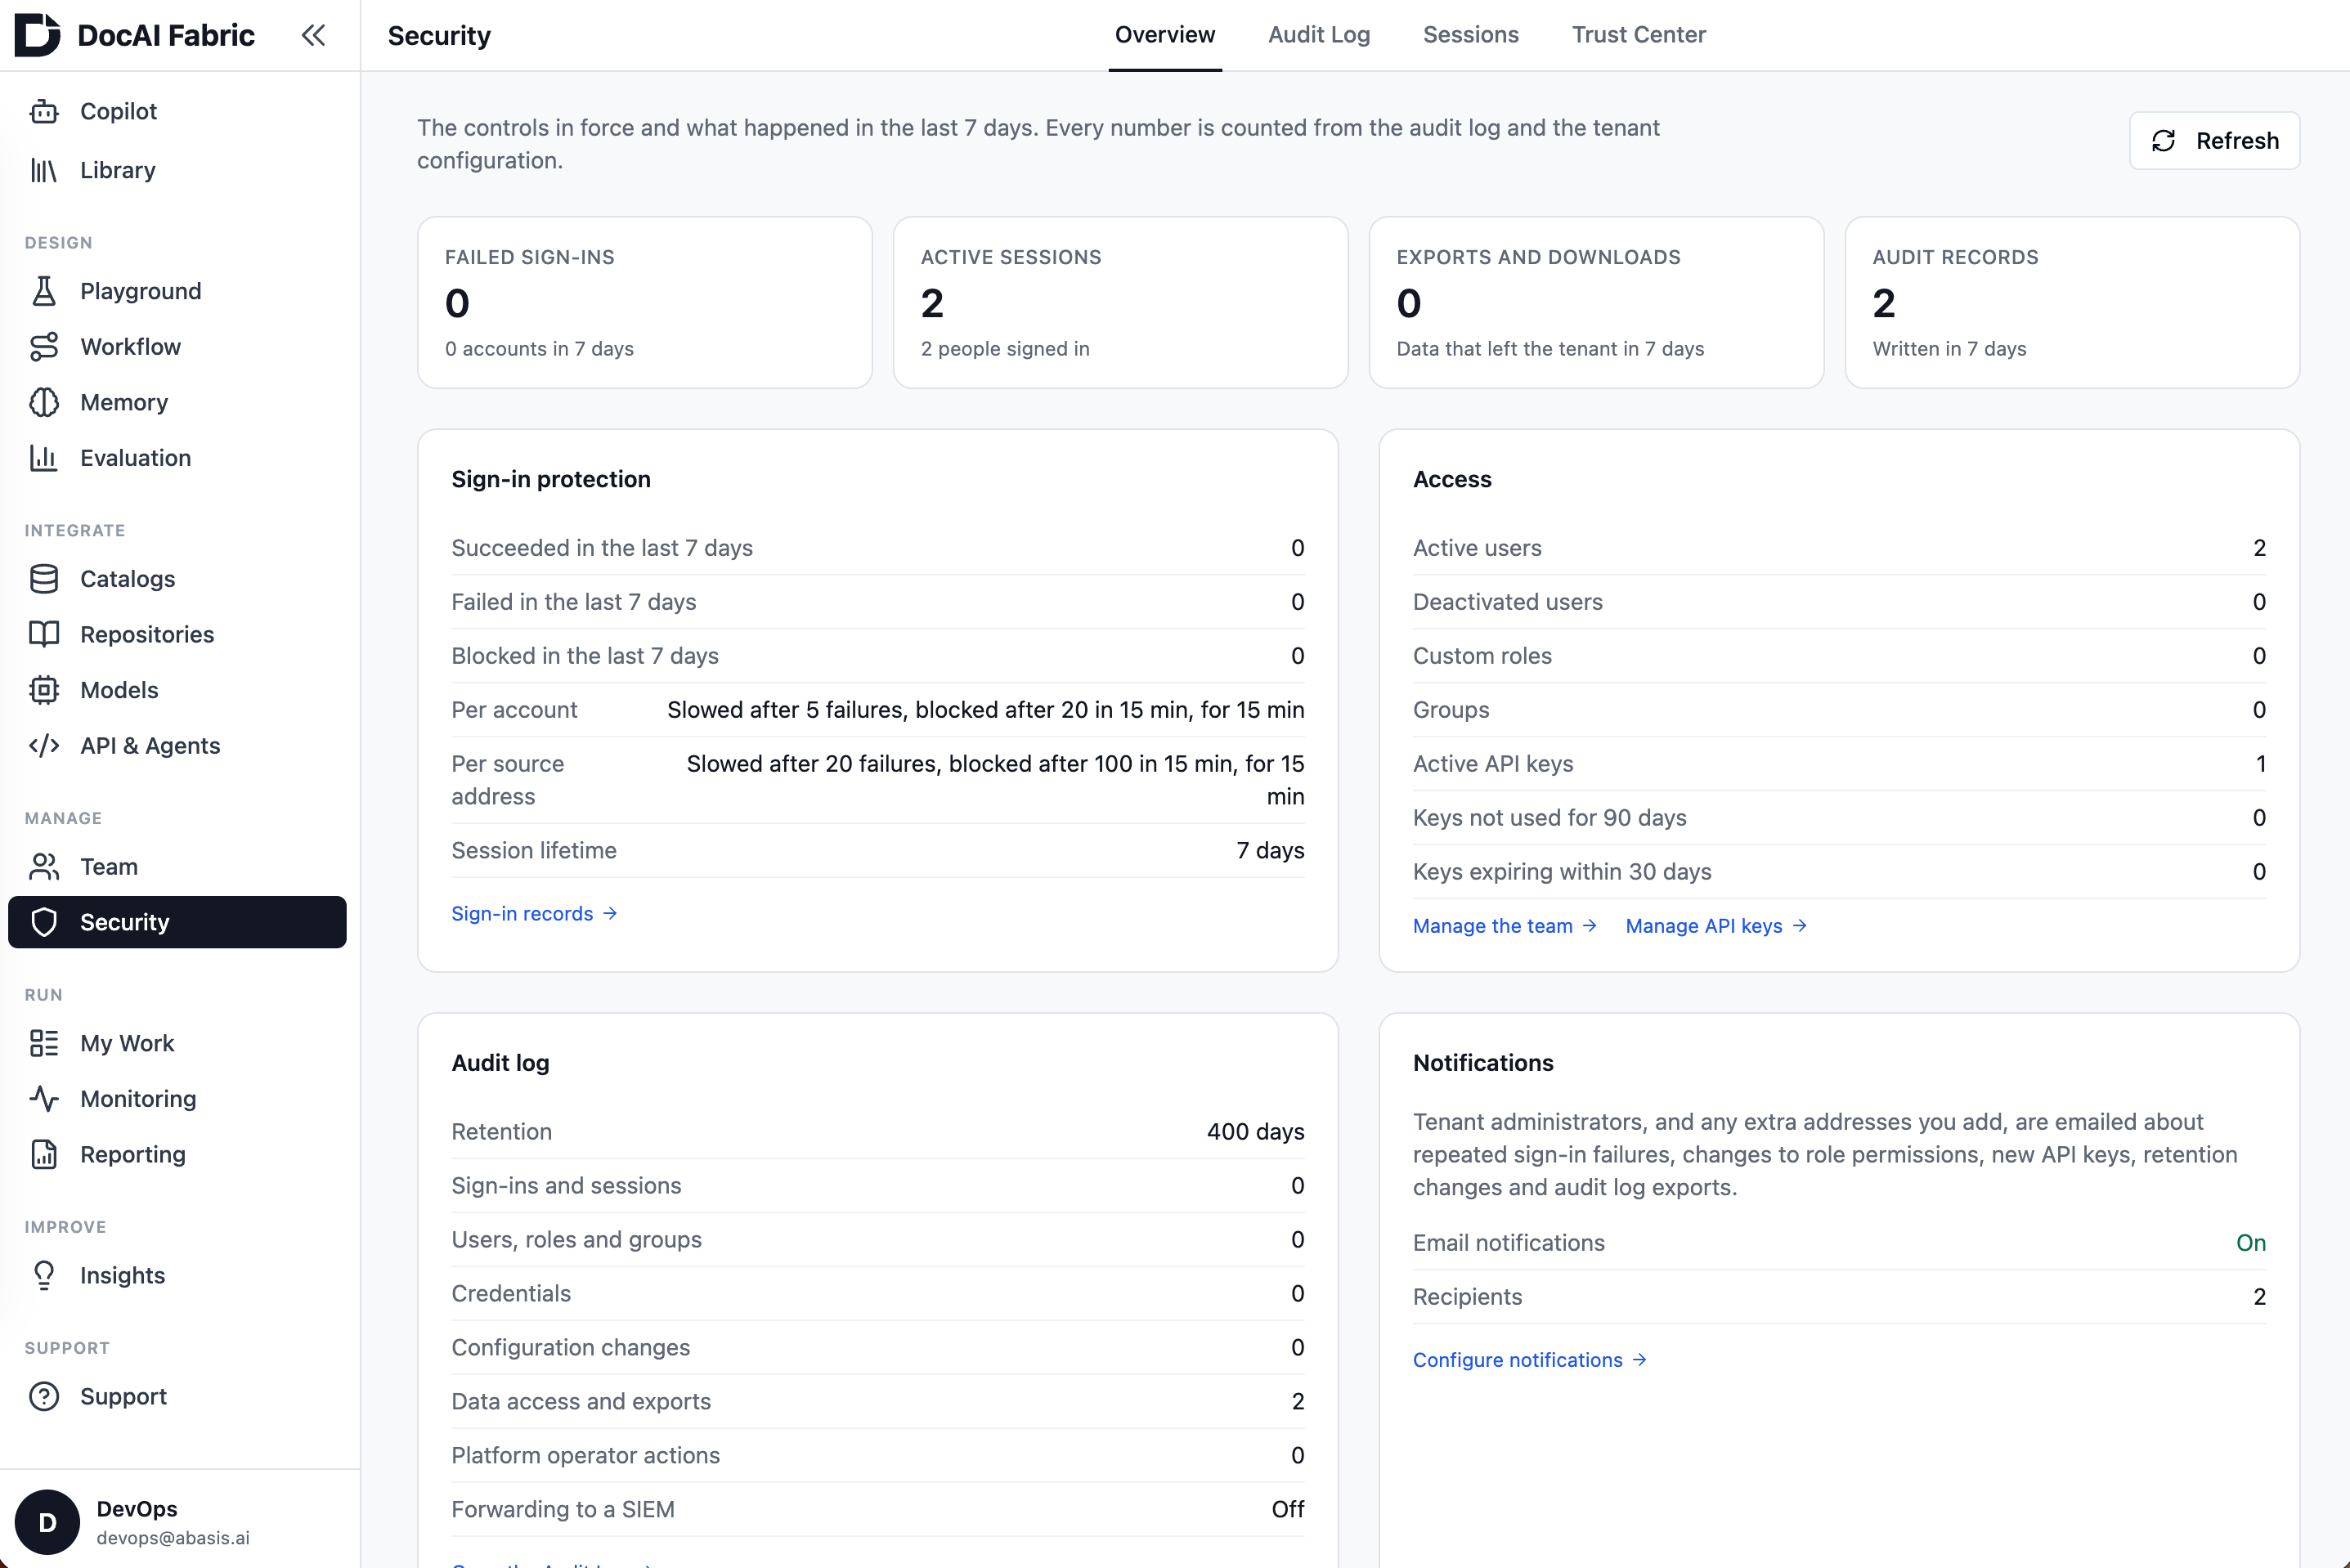
Security, under Manage in the sidebar, gathers your tenant’s security posture in one place. It reflects a continued investment in running DocAI Fabric as an enterprise platform, where every control is visible and every sensitive action leaves a record.
- Overview: the controls in force and what happened in the last seven days, every number counted from the audit log and the tenant configuration. Sign-in throttling per account and per source address, active users and API keys, keys not used for 90 days or expiring within 30, and whether security notifications are on.
- Audit Log: the append-only record of who did what in the tenant. Sign-ins and failed sign-ins, changes to users, roles, and groups, API keys and connector credentials, configuration that reached production, data exports and downloads, deletions. Filter it, export it, or forward it to your SIEM. Reading or exporting the log is itself recorded. See the audit log.
- Sessions: everyone signed in to the tenant right now, with when they signed in, when they were last active, the source address, and the browser. End one session or all of a person’s sessions from the row menu; both are recorded. During an incident this is the answer to “who has access right now”.
- Trust Center: how this deployment is run and where the tenant’s data goes, plus the public trust documents.
A built-in Security Auditor role holds the read and export permissions and nothing else, so a compliance reviewer can read the log and configure forwarding without being able to manage users or the tenant. Tenant administrators are emailed about repeated sign-in failures, changes to role permissions, new API keys, retention changes, and audit log exports, and you can add a security team mailbox to the recipients. See security.
Want updates like this by email?
Occasional highlights, straight to your inbox. Unsubscribe anytime.